

This time is different

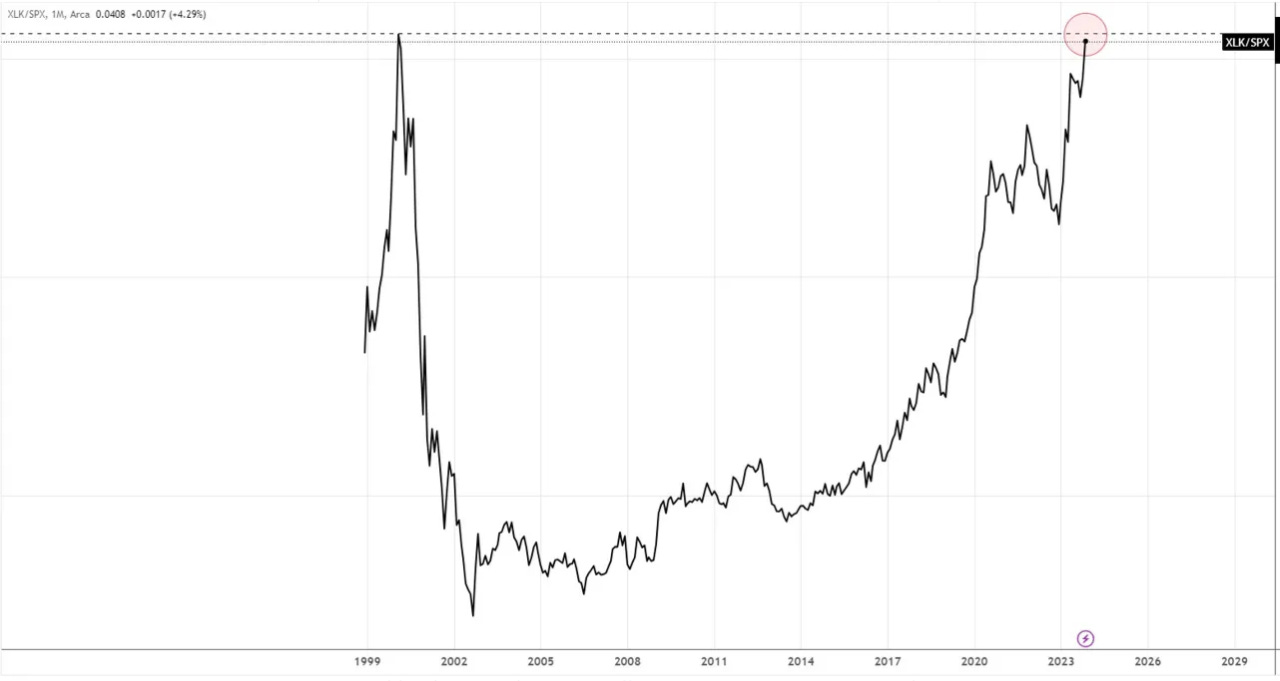
A chart was circulating in the financial channels about the end of November 2023: the ratio between the US tech sector and the S&P 500, which has reached the same levels as the internet bubble of 2000, foreshadowing a similar epilogue as per some market experts.
Below I show a chart I put together, pointing out the differences with the internet bubble.

In the upper part the sp500 with a logarithmic scale and in the lower part the differential of returns between the S&P 500 Equal Weight and the S&P 500 index cap weighted, as we know it. In the case of the equal weight, the same weight (0.2%) is given to each of the 500 stocks, regardless of their market capitalization.
I analyzed the market trend of the last 25 years.
The rise of the S&P 500 in the second half of the ‘90s (which includes the LTCM and Russian debt crisis) was characterized by a divergence between the positive performance of the index and the negative differential between the S&P 500 equal weight and the S&P 500 cap-weighted. This means a growing overperformance of a few stocks that became more and more capitalized and that determined a greater concentration.
Subsequently, during the first leg of the decline following the bursting of the internet bubble, all the companies whose capitalization had inflated compared to the rest of the index components were swept away. Those who had inflated excessively exploded ruinously.
We understand this from the divergence between the fall of the S&P 500 index and the rapid rise of the differential that reaches a maximum peak never repeated.
In this case the smaller companies consistently outperformed the larger ones, then the weight of the large cap stocks in the market cap weighted index eventually decreased. This reduced the gap between the two indexes offsetting the unbalance.
After the dotcom bubble, the declines were instead characterized by the negativization of the differential, highlighting the solidity of the most capitalized companies.
Following the trend of the arrows (black for the index declines and green for the rises) one could simplify by saying that: in the post-GFC market the rises are more democratic, at least in the phases of economic expansion, but the declines tend to make a selection among the less capitalized. If 25 years ago the technology sector was purely speculative, today it assumes typical characteristics of value too.
This in my opinion is a reflection of the evolution in the real economy: the tech megacaps far from being an empty box like the companies of the dawn of the internet concentrate on themselves all the potential changes that will affect the service sector in particular, which represent the largest slice of the GDP of the western economy.
I do not have a clear idea of the possible consequences for workers. Whether an increase in productivity with the same level of employment or an increasing gap between “rich and poor”.
In the second case, the public sector should intervene because there would be a contraction of demand with consequences on the megacaps themselves.
Here’s a chart from Visualcapitalist (https://www.visualcapitalist.com/sp/3-reasons-why-ai-enthusiasm-differs-from-the-dot-com-bubble/)
It points out 3 reasons that give a kind of confirmation of my analysis:
1- Valuations Are Lower
2- Investors Are More Hesitant
3- Companies Are More Established

…confirmation of my analysis…to some extent
Here is the rise of the S&P 500 in the last few months:

and here the evolution of the “S&P 500 Equal Weight vs. S&P 500 Total Return Differential - Rolling 12M”:

Chart retrieved from https://www.spglobal.com/spdji/en/
Thank you for sharing your analysis!